Open the coin glass app and every figure looks equally authoritative: open interest, funding rate, 24-hour liquidations, a heatmap glowing yellow a few percent from spot. They are not. Some of what CoinGlass shows is measured — reported by an exchange and passed through. The rest is modelled — inferred by an algorithm from information no exchange ever published.
Almost every expensive mistake made with crypto derivatives data comes from mixing the two up. A trader who moves a stop-loss because a heatmap band looks bright has treated a leverage estimate as an order book. It is not one, and the platform that drew it says so.
This site is not CoinGlass and has no relationship with it. What follows is a working map: what the platform holds, what it infers, where it undercounts, and what it costs.
What CoinGlass actually is
CoinGlass is a read-only aggregator of crypto derivatives data — not an exchange, not a broker, not a custodian. Its own phishing advisory states the platform supports neither trading nor deposits nor withdrawals. No order book, no balance, no withdrawal button. Everything on screen was reported by a third-party venue or calculated from that venue's data.
The corporate entity on the App Store listing is Coinglass Technology Co., Limited. Community sources place its founding in 2019 under the name Bybt, but no primary page confirms it, and no founder, headquarters or funding history is verifiable. Read-only is also your best safety heuristic.
A data site never needs your wallet
CoinGlass warned in January 2024 that a Google search for its name can surface a phishing clone, and confirmed its real site and app will not ask users to link a wallet. The lookalike coinglass.online is flagged as a probable scam. The platform holds no funds, so any page bearing the name that asks for a seed phrase, wallet connection or deposit is fraudulent. Our walkthrough of the real CoinGlass login flow and its phishing lookalikes covers the tells.
The product map
The platform is broad rather than deep: dozens of views on one feed. These carry weight.
Liquidations
24-hour totals, long/short split, per-exchange breakdown, count heatmaps, largest events ever.
Open interest
Aggregated and per-venue, with the stablecoin- versus coin-margined split.
Funding rates
Snapshot, history, cross-exchange heatmap, arbitrage screener.
Long/short ratios
Four ratio types, plus Hyperliquid whale positions with estimated liquidation prices.
Options and max pain
Open interest by strike, call/put split, gamma, max pain: Deribit, Binance, OKX, Bybit.
ETF flows
IBIT, FBTC, GBTC, ARKB and others: net flow, AUM, premium to NAV.
Indicators
CDRI, CGDI, Bull Market Peak Signals, AHR999, Pi Cycle Top, Puell Multiple.
Supercharts and Legend
Legend puts a live liquidity heatmap over candles and adds footprint charts.
Screener and alerts
Alerts on price, open interest, gas fees, mempool size and whale moves.
CDRI, the gauge at the top of this page
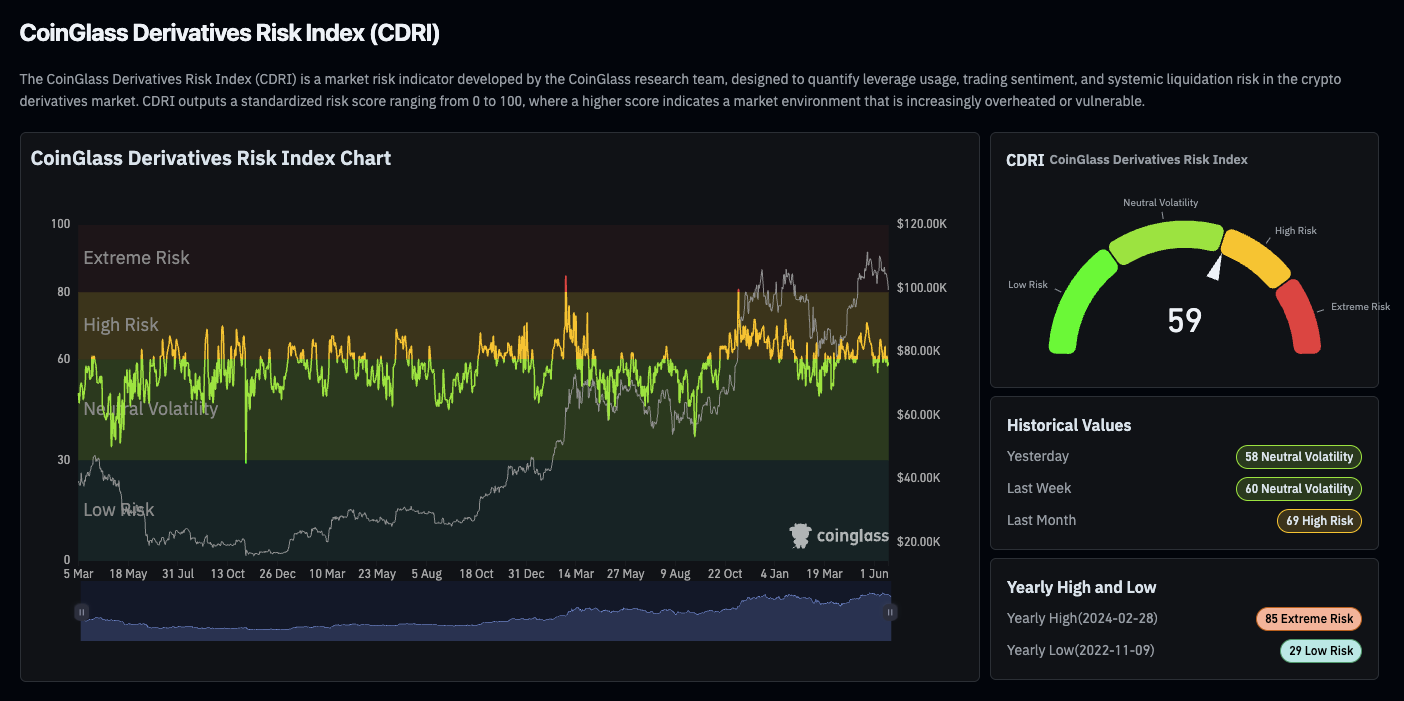
The CoinGlass Derivatives Risk Index launched on 18 June 2025 and scores the leveraged market 0 to 100, higher meaning more overheated. Four bands: 0–30 low risk, leverage conservative; 30–60 neutral volatility, structure healthy; 60–80 high risk, leverage piling up; 80–100 extreme risk, forced-liquidation danger surging.
Seven inputs feed it — open interest, funding rate, average leverage multiple, long/short deviation, implied volatility, 24-hour liquidation volume, change in volume heat. The weighting has never been published, so CDRI is a proprietary composite nobody outside can audit: a rough thermometer, not evidence.
Measured vs modelled
Every figure on a derivatives dashboard belongs to one of two categories, and the interface gives no clue which. This is the distinction the rest of this site is built on.
Measured
An exchange reported it
Open interest, funding rates, volume, options open interest by strike, ETF creations and redemptions, exchange wallet balances. These come out of a venue's own systems by API. They can be delayed or revised, but nobody guessed at them. When two sites disagree here, it is a different exchange set, not a different model.
Modelled
An algorithm inferred it
Liquidation heatmaps and maps, estimated liquidation prices for whales, CDRI, every composite index. No exchange publishes entry price or leverage per position, so these are reconstructions built on assumptions. CoinGlass ships three heatmap models with different assumptions — an admission that none is authoritative.

CoinGlass is candid about this on its learn pages, calling heatmap levels a relative intensity indicator and noting real liquidation amounts may fall short of the surface. Independent testing puts the gap at roughly one to three percent. Our breakdown of how a liquidation heatmap is built and where its colours mislead takes that apart.
"CoinGlass exchange": the honest answer
Anyone searching for a coinglass exchange is looking for something that does not exist. You cannot open an account, fund it or place an order. The search means one of two things: which exchanges CoinGlass covers, or how to compare venues using its data. On coverage, its API page names them rather than hiding behind a "30+" claim.
| Market | Count | Venues named |
|---|---|---|
| Futures (CEX) | 21 | Binance, OKX, Bybit, CME, Bitget, Deribit, BitMEX, Bitfinex, Gate, Kraken, KuCoin, CoinEx, BingX, Coinbase, Crypto.com, Bitunix, MEXC, HTX, WhiteBIT, LBank, ApeX Omni |
| Futures (perp DEX) | 9 | Hyperliquid, dYdX, Aster, Lighter, EdgeX, Drift, Paradex, Extended, tradeXYZ |
| Spot | 11 | Binance, OKX, Bybit, Coinbase, Bitfinex, Kraken, Gate, Bitget, Bitstamp, Crypto.com, Upbit |
| Options | 4 | Deribit, Binance, OKX, Bybit |
Thirty futures venues in total. The nine perpetual DEXs mark a deliberate expansion out of centralised-exchange-only coverage, with the Hyperliquid whale tracker as its front end. Exchange rankings, futures basis and per-venue reserves are the closest thing to the comparison people want. Note the limit: nothing here assesses a venue's solvency, licensing or custody.
"CoinGlass blockchain": no chain, no token
There is no coinglass blockchain and no CoinGlass token. The company runs no network, has never held a token sale and issues no coin. It is a data business selling a website, an API and an app. The name suggests otherwise, which is why the search exists.
Any "CoinGlass token" is a scam
Because no token exists, every presale, airdrop claim page, staking pool or listing announcement using the CoinGlass name is fraudulent. No further checking needed. The same goes for any "CoinGlass wallet": a read-only platform has nothing to issue and nothing to custody.
What it does cover that touches on-chain data is narrower: exchange balances and reserves, stablecoin supply, ETF creations and redemptions, token unlock schedules, mempool size and gas fees as alert triggers, and live Hyperliquid perpetual positions read off that chain. It reads public chain data; it produces none.
The one-liquidation-per-second problem
The platform's headline liquidation figures are structurally too low, and CoinGlass says so itself. Binance has capped its public liquidation stream at one order per symbol per second since 24 April 2021; its developer docs confirm only the largest liquidation in each 1,000-millisecond window is pushed. OKX applied the same limit from September 2021. Bybit had it, then began publishing all orders.
The consequence is perverse. In a quiet market the feed is accurate. In a cascade, hundreds of liquidations per second collapse into one, so the undercount is worst during exactly the events people open CoinGlass to watch.
| Source | Claim | Implied gap |
|---|---|---|
| Ben Zhou, Bybit CEO (Feb 2025) | Internal records showed $2.1bn; aggregators displayed $333m | ≈ 6.3× |
| Jeff Yan, Hyperliquid | Underreporting in extreme bursts could reach 100x | up to 100× |
| CoinGlass, 2025 annual report | Reported $19bn+ for 10 Oct 2025; true scale $30–40bn | 1.6–2.1× |
| Vetle Lunde, K33 Research | Public liquidation feeds unreliable since 2021 | — |
CoinGlass posts a push-frequency warning on its liquidation pages, more disclosure than most aggregators offer. It does not gross the headline up. The figure you see is the throttled one.
Where these numbers come from
Coverage, pricing and product detail come from CoinGlass's own pages — API, Prime, developer docs, the 2025 annual report — observed 27 July 2026. Throttling figures come from CoinGlass and Binance's liquidation order stream documentation. Cascade detail is corroborated by CoinGecko, CCN and CoinDesk.
10 October 2025, read properly
The largest single-day liquidation event in crypto history is the best worked example of reading this data without being misled. The trigger was an announcement of 100% tariffs on Chinese imports plus export controls. Bitcoin had set an all-time high near $126,000 shortly before.
- 10 Oct 2025The cascade
Over $19bn liquidated, cited everywhere as "according to CoinGlass". Longs were 85–90% of it. Over 1.6 million accounts liquidated.
- 21:15 UTCPeak minute
$3.21bn in one minute; $6.93bn over forty minutes. Derivatives volume hit $748bn on the day.
- 10–11 OctDeleveraging
Over $70bn of open interest eliminated in two days. Bitcoin fell 14.5% to $104,782, Ethereum 12.2% to $3,436, Solana briefly shed over 40%.
Now the corrections. The $19bn is throttled; CoinGlass's own estimate of the real total is $30–40bn. More often missed: liquidated is not lost. That $19bn is notional position value, not trader losses, which were far smaller, because notional is a multiple of the margin at risk. The open interest collapse is the more honest figure, coming straight from exchange reporting rather than a rate-limited stream.
For scale, CoinGlass's 2025 annual report puts the year's liquidations near $150bn against derivatives volume of $85.70 trillion. One day was an eighth to a quarter of the year.
Reading the data is step one. Seeing it move is step two.
Charts of open interest and funding make far more sense next to a live book you can actually watch.
Sponsored link. We may earn a commission if you open an account through it, at no extra cost to you. This is not investment advice, and leveraged products can lose you more than you deposit. See our disclaimer.
Free vs paid, honestly
The free tier is genuinely generous, which is why CoinGlass became the default citation. Open interest, funding, liquidation totals, long/short ratios and ETF flows need no account. Paid tiers restrict depth — history, asset coverage, refresh rate — not the core data.
| Product | Price | What it gets you | Commercial use |
|---|---|---|---|
| Free website | $0 | Most market data; heatmap on BTC and ETH only, 6- and 12-month views, manual refresh | n/a |
| Prime | $28 / mo | Or $78 quarterly, $268 annually, all identical: three heatmap models, all assets, auto-refresh, 24-month+ history | n/a |
| API Hobbyist | $29 / mo | 80+ endpoints, 30 req/min | No |
| API Startup | $79 / mo | 130+ endpoints, 80 req/min | No |
| API Standard | $299 / mo | 150+ endpoints, 300 req/min | Yes |
| API Professional | $699 / mo | 160+ endpoints, 1,200 req/min | Yes |
Three things to know first. There is no free API tier — the website is the only preview. Commercial use is gated at the $299 Standard plan, so a hobbyist licence will not cover a product you sell. And every tier below Enterprise states latency up to one minute, ruling CoinGlass out as an execution data source whatever you pay.
The coin glass app on mobile
The mobile app is a monitoring and alerting tool, not a smaller website. Free on both platforms, no in-app purchases on iOS, and built around alerts and watchlists rather than the heavy charting products.
The iOS build sat at version 2.7.6 with a 4.9 rating from around 5,700 ratings on 27 July 2026, published by Coinglass Technology Co., Limited under App Store ID 1522250001, running on iOS 12 or later plus Apple Silicon Macs and Vision Pro. The Android package, com.coinglass.android, reports over a million installs and a 4.78 rating from roughly 55,000 ratings per AppBrain. There is no Windows or desktop build. Our guide to downloading the CoinGlass app safely on iOS and Android covers the APK question, which matters more than it sounds.
Where the alternatives are better
CoinGlass's advantage is breadth plus a free tier, not depth. On most single dimensions something else beats it.
| Tool | Where it wins |
|---|---|
| Coinalyze | Closest substitute — Similarweb ranks it the highest-similarity site. Leaner, chart-first. |
| Velo | Institutional terminal with cleaner cross-venue basis and term structure. Built for desks. |
| Laevitas | Options first: volatility surface, skew, gamma. Weaker on liquidations. |
| Amberdata | Enterprise plumbing — normalised raw feeds by API or warehouse. Not a dashboard. |
| Glassnode | On-chain leader: UTXO cohorts, SOPR, entity-adjusted metrics. Complements, not replaces. |
| CryptoQuant | Exchange flows and miner behaviour. Overlaps on balances, leads on attribution. |
| Hyblock Capital | The most direct rival on liquidation modelling. Subscription-only, no large free tier. |
| TradingView | Charting and community. Funding and open interest for some symbols, no liquidation heatmap. |
Who should use this, and who should not
CoinGlass earns its place for anyone who needs a cross-venue view of leverage and cannot build one. One rule of thumb decides it: if the question is where leverage is concentrated, this is the cheapest good answer available; if the question is what price does next, no dashboard answers that.
Worth your time if you
- Want to see when leveraged positioning is crowded
- Need one screen for thirty futures venues, on-chain perpetuals included
- Track ETF flows, funding spreads or exchange reserves as context
- Want alerts pushed to Telegram or a webhook
- Are researching a past event and need a dated series
Look elsewhere if you
- Need sub-second data; every tier below Enterprise is capped at one minute
- Want accurate liquidation totals mid-cascade, which no public feed offers
- Trade options seriously, where a volatility platform is stronger
- Expect heatmap bands to work as entries, targets or stops
- Want to trade, hold funds or buy a token — none exists here
The bottom line
Use CoinGlass as a map of where leverage sits, delayed and rounded down. Treat everything measured — open interest, funding, volume, ETF flows — as reliable within its coverage. Treat everything modelled — heatmaps, estimated liquidation prices, CDRI — as an argument, not an observation. Nothing here is financial advice.
Glossary of the terms on screen
Eight terms account for most of what a derivatives dashboard displays, each labelled measured or modelled.
Crypto derivatives data, defined
- Open interest
- Measured. Notional value of contracts open and unsettled. Rising with price means new money entering; falling means positions closing.
- Funding rate
- Measured. A recurring payment between longs and shorts that holds a perpetual near spot. Positive means longs pay: a crowded long side.
- Liquidation
- Measured, undercounted. Forced closure by a risk engine once margin drops below maintenance. Public feeds throttle during bursts.
- Long/short ratio
- Measured. The balance of bullish against bearish positioning. CoinGlass publishes four versions, which routinely disagree.
- Liquidation heatmap
- Modelled. An estimate of where positions would be forced to close, from open interest plus assumed leverage. Brighter means denser, not more dollars.
- Max pain
- Derived. The options strike at which the largest contract value expires worthless. Often misread as a forecast.
- Perpetual futures
- Contract type. A futures contract with no expiry, pulled toward spot by funding rather than settlement. Where most crypto leverage lives.
- Notional value
- Unit of account. A position's face value, not the margin behind it: $10,000 at 20x is $10,000 notional against $500.
Frequently asked questions
Is CoinGlass an exchange?
No. CoinGlass is a read-only derivatives data aggregator. Its own phishing advisory states plainly that the platform does not support trading, deposits or withdrawals. It holds no customer funds, quotes no order book of its own and cannot execute a trade. Every number it shows was either reported by a third-party venue such as Binance, OKX or Deribit, or calculated by CoinGlass from that venue data. If a page branded CoinGlass asks you to deposit or connect a wallet, it is fraudulent.
Is there a CoinGlass blockchain or a CoinGlass token?
Neither exists. CoinGlass operates no chain, issues no coin and has never run a token sale or airdrop. It is a data company whose product is a website, an API and a mobile app. Any token, presale, airdrop claim page or staking scheme using the CoinGlass name is a scam by definition. The confusion is understandable given the name, but the platform's on-chain involvement is limited to reading public data, such as Hyperliquid perpetual positions and exchange wallet balances.
Is the coin glass app free to use?
Mostly. The mobile app and the great majority of the website — open interest, funding rates, liquidation totals, long/short ratios, ETF flows — are viewable at no cost and without an account. Paid tiers gate depth rather than breadth. CoinGlass Prime costs $28 a month, $78 a quarter or $268 a year and unlocks all three liquidation-heatmap models, assets beyond BTC and ETH, longer history and automatic refresh. The API is a separate purchase starting at $29 a month.
Why do liquidation totals differ between CoinGlass and other sites?
Because no aggregator sees the whole market. Sites differ on which exchanges they include, how they handle throttled liquidation feeds, whether they count coin-margined and DEX perpetual contracts, and where they draw the boundary of a 24-hour window. Binance has pushed at most one liquidation order per symbol per second since 24 April 2021, and OKX since September 2021, so every public feed undercounts during exactly the cascades people cite it for. Treat cross-site totals as non-comparable.
What is the CDRI score on the CoinGlass homepage?
The CoinGlass Derivatives Risk Index is a proprietary 0–100 composite launched on 18 June 2025 that scores how fragile the leveraged market looks. Bands run 0–30 low risk, 30–60 neutral volatility, 60–80 high risk and 80–100 extreme risk. It draws on seven inputs including total open interest, funding rates, average leverage, long/short deviation, implied volatility, 24-hour liquidation volume and volume heat change. The weighting is undisclosed, so it cannot be reproduced independently.
Does a liquidation heatmap show real orders?
No. It shows modelled estimates. Exchanges do not publish entry price or leverage per position, so CoinGlass infers where positions probably sit from open interest plus assumed leverage distributions, then applies standard maintenance-margin formulas. CoinGlass itself describes the output as a relative intensity indicator and warns that actual liquidation amounts may come in lower than the levels drawn. Independent testing puts the deviation from real triggered liquidations at roughly one to three percent.
Does CoinGlass hold funds or need my wallet?
Never. The platform is read-only, so there is nothing for it to custody. Its login page asks for an email and password, or offers sign-in with Google, and contains no wallet connection of any kind. CoinGlass has warned publicly that a search for its name can surface a phishing clone, and the lookalike domain coinglass.online has been flagged as a likely scam. Any seed-phrase or wallet-connect prompt is the tell.
Is $19 billion liquidated the same as $19 billion lost?
No, and the conflation is common. Liquidation figures report the notional value of the positions that were forcibly closed, not the money traders actually lost. A $19 billion notional total at 20x leverage implies far less than $19 billion of destroyed margin. Realised losses on 10 October 2025 were substantially smaller than the headline. Use liquidation totals as a gauge of how much leverage was flushed out, not as a damage estimate.
Keep reading